
|
Bellwether Spotlight
Creating Value & Sparking Innovation
|
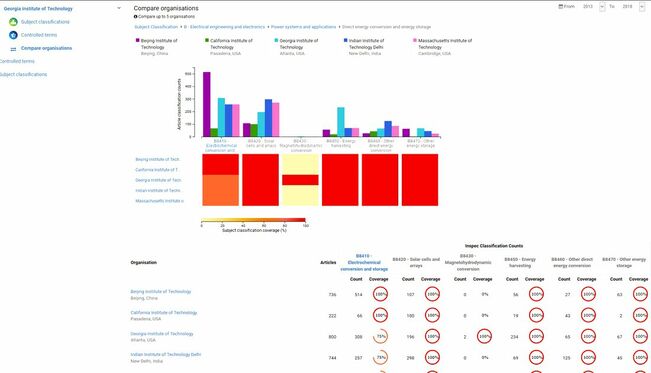 Organizational Comparison from Inspec Analytics User Guide Many have heard the siren’s call of linked data and the semantic technologies since first introduced in the 1990’s, only to be dashed on the rocks of the practical realities of implementation or needing to do a serious recalibration of approach. The vision of a semantic web with hyperdata links as ubiquitous as document hyperlinks is appealing, but Tim Berners-Lee’s vision may not be realized as he first envisioned it. However, adaptations of his dream are finding their way into early applications in financial services, healthcare and pharmaceuticals (Astra Zeneca), retail (eBay chatbot), enterprise applications (used for providing business insights, predictive modelling, repurposing and reusing content), and knowledge graphs like Google and Wikipedia. [For Google-watchers, see also Google’s recent patent profiled in OntoSpeak.]
In publishing, there are intriguing initiatives like Inspec Analytics and Springer Nature’s SciGraph (not covered here). In libraries, OCLC completed and published results of the third International Linked Data Survey in December 2018. Results suggest development is mostly experimental. This revealing survey, led by Karen Smith-Yoshimura and the OCLC Research Library Partnership team, includes survey results from 2014, 2015 and 2018, with insights into such projects – how respondents view measures of success, obstacles encountered, and lessons learned. The appeal for publishers and libraries of flexible data models is strong:
With this as context, the presentation of Inspec Analytics by Vincent Cassidy, Director of Academic Markets, at the February 2019 NFAIS meeting stands out as a compelling initiative because seems to deliver a pragmatic and substantive set of offerings. Like cracking the code, it seems like the perfect fit for an A&I service with depth of coverage, rich scientific metadata and loaded with value for the users, value for the customers, and value for the organization. Intrigued by Inspec Analytics, I followed up with an interview and demo with Tim Aitken, Senior Product Manager, reflected in this piece. So What is Linked Data? In semantic web terminology and for the uninitiated, linked data is used to describe a method of exposing and connecting data [often factual content] on the web from different sources. The web uses hyperlinks that allow people to move from one document to another. Linked data uses hyperdata links to do something similar, i.e. Barack Obama ... attended ... Columbia University, or the University of Toronto ... publishes ... ‘x’ articles ... on bioengineering. You can extract some of this information but it is far easier using linked data where the relationships are already created. It makes it easier for computers to make sense out of information by showing clearly defined relationships and then also link this information across different sources and types of content. Once these relationships have been established, using the information depends on how it is accessed and served up. This includes how the linked data is searched and how it is analyzed and presented via a graphical user interface (GUI).
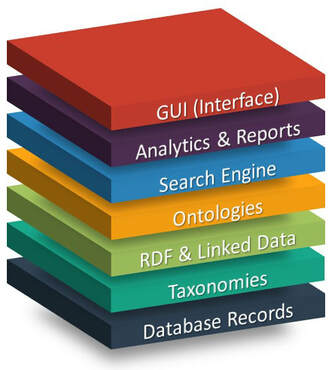
Traditional search matches words. This could be described as the “is” or “is not” of a traditional search. Semantic technology together with linked data adds another layer of meaning. It adds more ‘verbs’ (predicates) like “attended,” “works at,” “is married to.” Suddenly there are many more relationships than “is” or “is not.” These relationships are machine-readable and open the possibility to apply inference engines. For instance: Fact one: Millie graduated from Stanford University. Fact two: Stanford University is an accredited US institution. Inferred fact: Millie graduated from an accredited US institution. While not terrifically exciting at the level of this example, the more data available for analysis, the richer and more accurate the inference results. The Layered Look How do you recognize that semantic technologies are being used as part of a product? How “smart” is a potential resource? It may not affect the quality of the product offerings, but it may define attributes related to speed, efficiency, interoperability, and flexibility for future development. For instance, Dimensions says they have “linked research data.” That could mean more than one thing and is useful to explore to understand the full capabilities. In what ways is machine learning integrated (or not)? What types of data analytics are employed?
Potential (discrete) components of a modern reference database. All may not be present:
Working from the bottom up:
Inspec Analytics: Exposing New Value For A&I services, excellence in discovery with high precision and recall is a strength. Discovery is enhanced with the additional linked data. Discovery is important but it is only one capability. With Inspec Analytics, the metadata itself has new life and value, offering ways to use just the metadata for institutional profiles, significant research into who is publishing what and where, or identifying other researchers for collaboration. This can be done at levels of extreme and flexible granularity and multiple views. Users are asking questions of the metadata itself like:
Measuring Success Early measurements of success include statistics that show they are using the database longer, with more frequent visits, and printing reports to share with colleagues. New types of users are enthusiastic and engaged. Librarians are also pleased that the additional services are drawing users to a quality resource. A Significant Transformation This is a strong strategic play for Inspec on multiple fronts. Despite the missional nature of the decision, they knew it would be a value-added play, not tied to additional revenue. Projects like this represent a significant commitment of time and resources. Just considering the roughly 30-40 people involved (some shared with another project) reflects a considerable investment and new staff composition. For example, this includes 4 additional data scientists for statistical analysis, 3 developers designing and implementing linked tables, testing teams and external specialist consultants in addition to technology vendors. At a Rave Technologies talk in December, David Smith, Head of Product Solutions, joked that the first two years involved “trust” by senior management until the vision began to unfold. The project started in 2015, along with a decision to upgrade their entire platform and leverage that development. For the past year, 100 institutions have had access to a beta version of Inspec Analytics to provide feedback, soon to come out of beta with access by all Inspec customers as part of their subscriptions.
Conclusion The new flexible data models and related outputs also offers serious competitive advantages besides greater direct engagement with users looking to mine the data, suggesting fertile ground for other benefits to follow. As Tim Aitken aptly put it when I interviewed him, clearly feeling the excitement from their user community, “Inspec Analytics has unlocked the treasure trove that is Inspec.” We look forward to watching their space! Inspec Analytics https://inspec-analytics.theiet.org/ Additional visuals and explanations of feature available in Inspec Analytics User Guide. Acknowledgements With special thanks and appreciation to Tim Aitken, IET Inspec Analytics, and Bill Kasdorf, Kasdorf & Associates, for their time and much appreciated contributions! © 2019 M Adamson Associates. All Rights Reserved. Comments are closed.
|
Maureen Adamson
Creativity in content, in services, in business models and marketing when they align into new ways of engaging the user draw my attention. This blog explores the innovations, people and trends that intrigue or inspire, offering insights into the future of publishing and scholarly communications. Archives
February 2023
Categories
All
|
|||||||||||||
 RSS Feed